Peaches and nectarines are stone fruits that thrive in warm-temperate climates. They are thought to have originated in China and later spread to Persia and Europe.
Although both belong to the same species (Prunus Persica) and family (Rosaceae), they look distinct. Peaches have fuzzy skin, while nectarines have smooth skin because of a genetic difference.
Both peaches and nectarines are nutrient-dense. Peaches contain ample amounts of vitamins A and C, antioxidants, potassium, and dietary fiber. Along with Vitamin C and potassium, nectarines are also rich in Vitamin B3 and copper.
The United States Department of Agriculture (USDA) estimates the global peach and nectarine production in the 2025-2026 marketing year (MY) at 23.83 million metric tons. The article covers total production, share of global output, year-over-year change, and 10-year average for leading peach and nectarine-producing nations.
Here’s the latest peach and nectarine production by country data from the USDA:
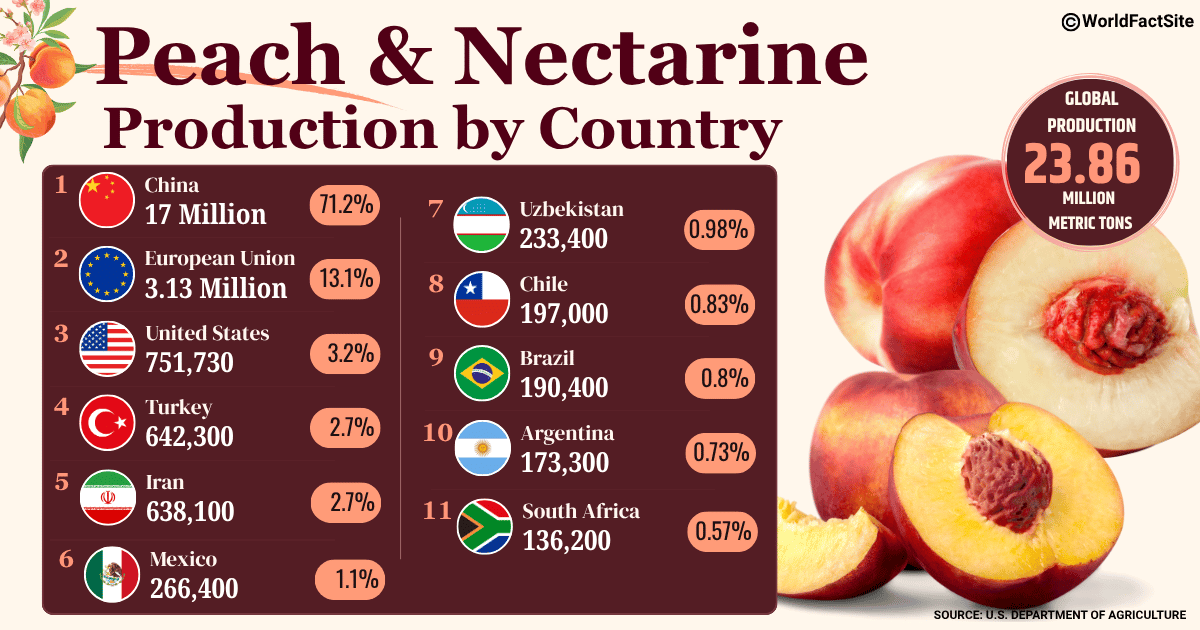
Leading producers of peaches and nectarines in the world in MY 2025/26
| Country | Total Production in Metric Tons | % Share in Global Production |
|---|---|---|
 China | 17 Million | 71.2% |
 European Union | 3.13 Million | 13.1% |
 United States | 751,730 | 3.2% |
 Turkey | 642,300 | 2.7% |
 Iran | 638,100 | 2.7% |
 Mexico | 266,400 | 1.1% |
 Uzbekistan | 233,400 | 0.98% |
 Chile | 197,000 | 0.83% |
 Brazil | 190,400 | 0.8% |
 Argentina | 173,300 | 0.73% |
 South Africa | 136,200 | 0.57% |
1. China
China dominated the market with 71.2% of worldwide output of peaches and nectarines in the marketing year 2025/26, amounting to 17 million metric tons. Despite this significant share of global production, it was 3% lower than the previous year’s output (MY 2024/25), which was 17.6 million metric tons.
- 10-Year production stats (MY 2016-2025):
- Production average: 15.79 million metric tons
- Compound average growth: 2%
2. European Union
In MY 2025/26, the European Union’s estimated production of 3.13 million metric tons was about 8% lower than 3.39 million metric tons of output in MY 2024/25. Still, it holds a significant 13.1% share of international peach and nectarine output.
- 10-Year production stats (MY 2016-2025):
- Production average: 3.51 million metric tons
- Compound average growth: -2%
3. United States
The United States’ peach and nectarine production in MY 2025/26 was 751,730 metric tons. This volume, representing a 3.2% share of global production, was 3% higher than the MY 2024/25 output of 728,832 metric tons.
- 10-Year production stats (MY 2016-2025):
- Production average: 732,162 metric tons
- Compound average growth: -1%
4. Turkey
After managing to generate 1.18 million metric tons of peaches and nectarines in MY 2024/25, Turkey saw output fall by 46% in MY 2025/26 to 642,300 metric tons. With this drop, the country’s share of global production remained at just 2.7%.
- 10-Year production stats (MY 2016-2025):
- Production average: 875,284 metric tons
- Compound average growth: -0.48%
5. Iran
Iran is a leading peach and nectarine producer, with a harvest of 638,100 metric tons in MY 2025/26. The amount remained the same as in MY 2024/25. It accounted for 2.7% of worldwide output this year.
- 10-Year production stats (MY 2016-2025):
- Production average: 577,600 metric tons
- Compound average growth: 4%
6. Mexico
Peaches and nectarines production in Mexico during MY 2025/26 turned out to be 266,400 metric tons. According to USDA records, the current production increased by 0.45% from 265,200 metric tons in MY 2024/25, supplying 1.1% of global output.
- 10-Year production stats (MY 2016-2025):
- Production average: 207,800 metric tons
- Compound average growth: 4%
7. Uzbekistan
Contributing around 0.98% of global peach and nectarine production in MY 2025/26, Uzbekistan logged an output of 233,400 metric tons. The current production has held steady since MY 2024/25.
- 10-Year production stats (MY 2016-2025):
- Production average: 202,360 metric tons
- Compound average growth: 1%
8. Chile
USDA’s estimates for Chile’s peach and nectarine output in MY 2025/26 show a 1% decline to 197,000 metric tons from 199,180 metric tons in MY 2024/25. As a result, Chile accounted for almost 0.83% of global peach and nectarine production.
- 10-Year production stats (MY 2016-2025)
- Production average: 169,186 metric tons
- Compound average growth: 3%
9. Brazil
At the end of the 2025-2026 marketing year, Brazil's peach and nectarine production showed no year-over-year change, remaining at 190,400 metric tons. This volume makes up a small share of global production at 0.8%.
- 10-Year production stats (MY 2016-2025):
- Production average: 203,740 metric tons
- Compound average growth: -0.16%
10. Argentina
Following its neighboring South American nation, Argentina bore 173,300 metric tons of peaches and nectarines in MY 2025/26. Matching the previous marketing year’s output (MY 2024/25), this volume stands for 0.73% of global production.
- 10-Year production average (MY 2016-2025):
- Production average: 168,450 metric tons
- Compound average growth: -4%
11. South Africa
Among the world's largest peach and nectarine producers, South Africa, with a final scale weight of 136,200 metric tons in MY 2025/26, is the only African country on this list. Since production volume was the same in MY 2024/25, its year-over-year change shows no rise or fall. Internationally, this contribution was about 0.57% of total production.
- 10-Year production stats (MY 2016-2025):
- Production average: 169,320 metric tons
- Compound average growth: -3%