Lemons and limes are citrus fruits from the same genetic family, with different appearances, flavor profiles, nutrient content, antioxidant richness, and culinary uses. Both fruits offer a wide range of wellness benefits, including hydration, digestion, and immune support. In the current marketing year (MY) 2025/2026, global lemon and lime production was recorded at 10.6 million metric tons by the United States Department of Agriculture (USDA).
The primary factors affecting lemon & lime production levels are climate, environmental conditions, agricultural management, and post-harvest handling. The article covers the 10 largest producers of lemons & limes by country and provides information on each nation’s annual harvest, contribution to worldwide output, and comparisons with previous year data.
Here are the 10 leading lemon & lime producers by country:
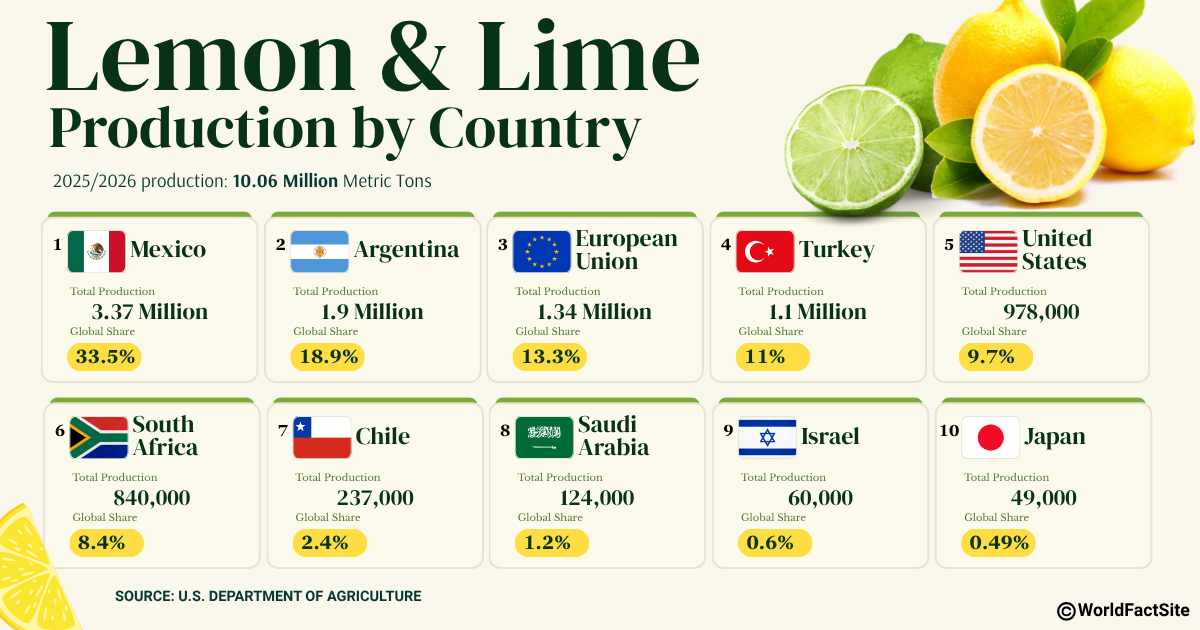
Annual lemon & lime production by country in 2025/2026, by USDA
| Country | Total Production (Metric Tons) | % Share of Global Production |
|---|---|---|
 Mexico | 3.37 Million | 33.5% |
 Argentina | 1.9 Million | 18.9% |
 European Union | 1.34 Million | 13.3% |
 Turkey | 1.1 Million | 11% |
 United States | 978,000 | 9.7% |
 South Africa | 840,000 | 8.4% |
 Chile | 237,000 | 2.4% |
 Saudi Arabia | 124,000 | 1.2% |
 Israel | 60,000 | 0.6% |
 Japan | 49,000 | 0.49% |
1. Mexico
Mexico’s lemon and lime output reached 3.37 million metric tons, with a harvested area of 219,490 hectares during the 2025/2026 marketing year (November-October), putting it ahead of all other producers. Mexico's contribution accounts for 33.5% of global lemon & lime production. In 2024/2025, the country’s total lemon & lime production was 3.28 million metric tons.
- 10-Year production level (MY 2016-2025):
- Average production: 2.92 million metric tons
- Compound average growth: 3%
- Year-over-year change: 3%
2. Argentina
Argentina's total lemon and lime production totaled 1.9 million metric tons during the marketing year 2025/2026 (January-December). According to the USDA, Argentina's output constitutes 18.9% of worldwide production. In marketing year MY 2024/2025, its lemon & lime production was estimated at 1.91 million metric tons.
- 10-Year production level (MY 2016-2025):
- Average production: 1.75 million metric tons
- Compound average growth: 3%
- Year-over-year change: -0.52%
3. European Union
Total lemon & lime production in the European Union reached 1.34 million metric tons, making it the third-largest producer in MY 2025/2026. The EU contributed 13.3% of global output of lemons & limes in MY 2025/2026. In the previous marketing year, production was noted at 1.53 million metric tons.
- 10-Year production level (MY 2016-2025):
- Average production: 1.56 million metric tons
- Compound average growth: -1%
- Year-over-year change: -12%
4. Turkey
Turkey is the world’s fourth-largest lemon and lime producer, accounting for 11% of the world’s total in MY 2025-26. Its overall production was calculated at 1.1 million metric tons for the current marketing year (September-August). Turkey’s total production level of lemons and limes in MY 2024/2025 was 1.73 million metric tons.
- 10-Year production level (MY 2016-2025):
- Average production: 1.3 million metric tons
- Compound average growth: 3%
- Year-over-year change: -36%
5. United States
With production reaching 978,000 metric tons in 2025-26 (August-July), the United States is the fifth-largest producer of lemons and limes, representing 9.7% of global output. The country’s total lemon & lime output was 1.01 million metric tons in the previous marketing year.
- 10-Year production level (MY 2016-2025):
- Average production: 915,600 metric tons
- Compound average growth: 2%
- Year-over-year change: -3%
6. South Africa
South Africa generated 840,000 metric tons of lemons & limes in MY 2025/2026, making up 8.4% of global output. As per the USDA, the country’s total lemon & lime production in MY 2024/2025 was 810,000 metric tons.
- 10-Year production level (MY 2016-2025):
- Average production: 650,300 metric tons
- Compound average growth: 7%
- Year-over-year change: 4%
7. Chile
Chile accounted for 2.4% of global lemons & limes production by country in the marketing year 2025/2026 (April-March). The South American country’s total lemon and lime production was observed by the USDA to be 237,000 metric tons. In the 2024/2025 marketing year, Chile’s total lemon and lime output was 227,000 metric tons.
- 10-Year production level (MY 2016-2025):
- Average production: 187,900 metric tons
- Compound average growth: 4%
- Year-over-year change: 4%
8. Saudi Arabia
In the 2025/2026 marketing year, Saudi Arabia's total lemon & lime production was 124,000 metric tons. Saudi Arabia's global contribution is nearly 1.2%. In the previous marketing year, total output remained unchanged from the current year.
- 10-Year production level (MY 2016-2025):
- Average production: 67,300 metric tons
- Compound average growth: NA
- Year-over-year change: 0%
9. Israel
According to the USDA, Israel's overall lemon & lime production is 60,000 metric tons in MY 2025/2026 (October-September). With a 0.6% share of global output, Israel is the ninth-largest producer. In MY 2024/2025, the country’s total production of lemons and limes was 62,000 metric tons.
- 10-Year production level (MY 2016-2025):
- Average production: 65,000 metric tons
- Compound average growth: -1%
- Year-over-year change: -3%
10. Japan
A leading lemon-and-lime-producing country, Japan has a global production share of 0.49%. With no yearly fluctuations, lemon and lime production in both MY 2025/2026 and the previous year, 2024/2025, was about 49,000 metric tons. Japan’s annual harvested area is 4,750 hectares in MY 2025/2026.
- 10-Year production level (MY 2016-2025):
- Average production: 49,000 metric tons
- Compound average growth: -0.78%
- Year-over-year change: 0%