Orange/Sweet orange (Citrus Sinensis) is a hybrid developed from two different citrus fruits: pomelo (Citrus Maxima) and Mandarin orange (Citrus reticulata). In the US, it is the most consumed fruit in the form of juice.
Oranges provide nutrients and minerals such as folic acid, vitamin C, potassium, and calcium, along with other phytonutrients and fiber. In 2025/2026, global production of oranges reached 45.92 million metric tons, according to the United States Department of Agriculture (USDA).
The article takes a deeper dive into orange production by country, showing individual output and its share in production both region-wise and worldwide, along with last year's output, year-over-year change, and average growth over the last decade.
Countries currently leading orange production worldwide:
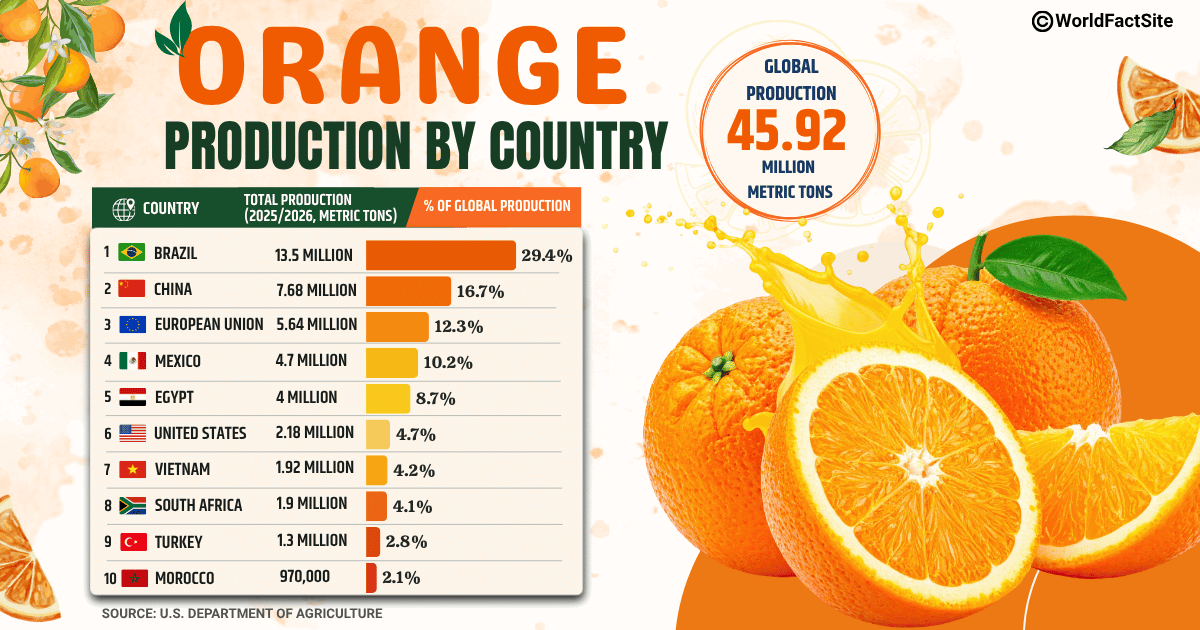
List of countries by highest orange production in the marketing year 2025-2026 (USDA)
| Country | Total Production in Metric Tons (Oranges, Fresh) | Share in Global Production (%) |
|---|---|---|
 Brazil | 13.5 Million | 29.4% |
 China | 7.68 Million | 16.7% |
 European Union | 5.64 Million | 12.3% |
 Mexico | 4.7 Million | 10.2% |
 Egypt | 4 Million | 8.7% |
 United States | 2.18 Million | 4.7% |
 Vietnam | 1.92 Million | 4.2% |
 South Africa | 1.9 Million | 4.1% |
 Turkey | 1.3 Million | 2.8% |
 Morocco | 970,000 | 2.1% |
1. Brazil
Also a leading coffee producer, Brazil is the largest producer of oranges in the world. According to the latest USDA data for the 2025/26 marketing year (MY), the nation’s harvest of 13.5 million metric tons of oranges represented a massive 93.85% share of total production in South America and 29.4% of global output, harvested from 570,000 hectares of land area.
- Production (MY 2024/25): 13 million metric tons
- Year-over-year change: 4%
- 10-Year production stats (MY 2016-2025):
- Average production: 15.69 million metric tons
- Compound average growth: -4%
2. China
China's orange output in MY 2025/26 was 7.68 million metric tons. This accounted for 16.7% of global orange production. China also dominated East Asia’s orange production with a share of 99.95%.
- Production (MY 2024/25): 7.62 million metric tons
- Year-over-year change: 0.79%
- 10-Year production stats (MY 2016-2025):
- Average production: 7.45 million metric tons
- Compound average growth: 0.93%
3. European Union
USDA projected the European Union’s orange production for MY 2025/26 at 5.64 million metric tons. Globally, this accounted for 12.3% of the world’s total orange output.
- Production (MY 2024/25): 5.93 million metric tons
- Year-over-change: -5%
- 10-Year production stats (MY 2016-2025):
- Average production: 6.22 million metric tons
- Compound average growth: -2%
4. Mexico
In MY 2025/26, Mexico’s total harvested area of 340,000 hectares for oranges generated 4.7 million metric tons. The nation accounts for 10.2% of global orange production and 68.35% of total orange output in North America.
- Production (MY 2024/25): 4.84 million metric tons
- Year-over-year change: -3%
- 10-Year production stats (MY 2016-2025):
- Average production: 4.52 million metric tons
- Compound average growth: 0.15%
5. Egypt
USDA noted Egypt among the top countries in orange production worldwide, contributing an 8.7% global share in MY 2025/26, totaling 4 million metric tons. Regionally, the nation also made its presence felt in North Africa, representing 80.48% of orange output. This output was obtained from a total harvested area of 160,000 hectares.
- Production (MY 2024/25): 3.5 million metric tons
- Year-over-year change: 14%
- 10-Year production stats (MY 2016-2025):
- Average production: 3.48 million metric tons
- Compound average growth: 3%
6. United States
USDA tallied U.S. orange production at 2.18 million metric tons in MY 2025/26. The nation represented the remaining 31.65% of North America’s regional orange production and constituted 4.7% of global production.
- Production (MY 2024/25): 2.17 million metric tons
- Year-over-year change: 0.18%
- 10-Year production stats (MY 2016-2025):
- Average production: 3.4 million metric tons
- Compound average growth: -7%
7. Vietnam
Among Southeast Asian countries, Vietnam leads in orange production, accounting for 99.69% of the region’s total output in MY 2025/26. The nation produced 1.92 million metric tons, making up nearly 4.2% of global orange production.
- Production (MY 2024/25): 1.92 million metric tons
- Year-over-year change: 0%
- 10-Year production stats (MY 2016-2025):
- Average production: 1.37 million metric tons
- Compound average growth: 10%
8. South Africa
South Africa produced 1.9 million metric tons of oranges in MY 2025/26, responsible for 4.1% of the world’s output. This is nearly 96.59% of orange production in Sub-Saharan Africa, harvested from 42,500 hectares of farmland.
- Production (MY2024/25): 1.9 million metric tons
- Year-over-year change: 0%
- 10-year production stats (MY 2016-2025):
- Average production: 1.64 million metric tons
- Compound average growth: 3%
9. Turkey
Representing around 2.8% of global output, Turkey’s orange production hit 1.3 million metric tons in MY 2025/26. When grouped under the Middle East geographic region, the nation produced oranges that made up 83.44% of the regional share.
- Production (MY 2024/25): 1.61 million metric tons
- Year-over-year change: -19%
- 10-Year production stats (MY 2016-2025):
- Average production: 1.69 million metric tons
- Compound average growth: -3%
10. Morocco
USDA reported Morocco’s annual orange output for the 2025-2026 marketing year at 970,000 metric tons. Its contribution to the world's orange production was 2.1%, and the crop was harvested from 54,950 hectares. The nation also claimed 19.52% of all North African orange production.
- Production (MY 2024/25): 960,000 metric tons
- Year-over-year change: 1%
- 10-Year production stats:
- Average production: 976,900 metric tons
- Compound average growth: -0.67%