Cherry is a temperate fruit obtained from the perennial, deciduous tree of the genus Prunus. It is low in calories, high in water content, and mostly cultivated for its delicious taste.
In the 2025-2026 marketing year (MY), the world produced 4.64 million metric tons of fresh cherries, both sweet and sour. The article details 2025/26 cherry production by country, covering the total output of major producing countries, their global and regional shares, the previous year’s output, the average output over the last 10 years, and more.
Here are the largest producers of cherries in MY 2025/2026:
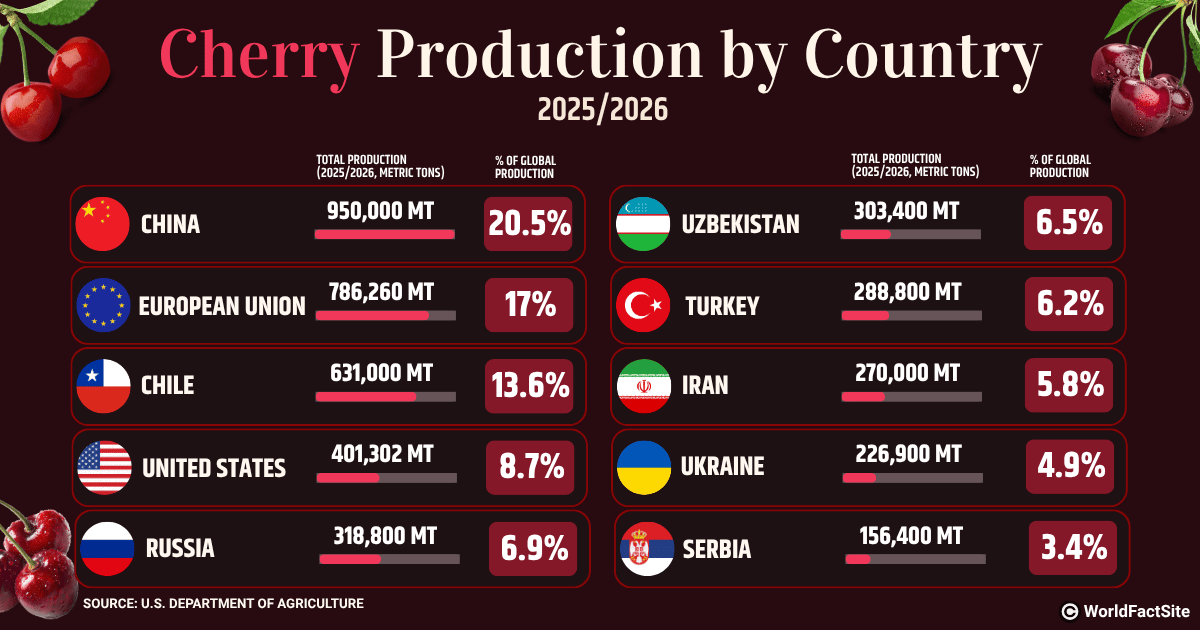
Annual cherry production by country in 2025/26 (USDA)
| Country | Total Production in Metric Tons | Share of Global Production (%) |
|---|---|---|
 China | 950,000 | 20.5% |
 European Union | 786,260 | 17% |
 Chile | 631,000 | 13.6% |
 United States | 401,302 | 8.7% |
 Russia | 318, 800 | 6.9% |
 Uzbekistan | 303,400 | 6.5% |
 Turkey | 288,800 | 6.2% |
 Iran | 270,000 | 5.8% |
 Ukraine | 226,900 | 4.9% |
 Serbia | 156,400 | 3.4% |
1. China
China produced the most cherries in the 2025/2026 marketing year (MY 2025/26). With 950,000 metric tons of fresh cherries, the nation held 20.5% of global production.
- Production (MY 2024/25): 850,000 metric tons
- Year-over-change: 12%
- 10-Year production stats (MY 2016-2025):
- Average production: 589,000 metric tons
- Compound average growth: 11%
2. European Union
The European Union, also a major cheese producer, generated 786,260 metric tons of cherries in the current marketing year. According to the USDA, the EU claims almost 17% of all fresh cherries produced globally in MY 2025/26.
- Production (MY 2024/25): 791,230 metric tons
- Year-over-year change: -0.63%
- 10-Year production stats (MY 2016-2025):
- Average production: 756,184 metric tons
- Compound average growth: 0.69%
3. Chile
Chile’s aggregate production of both fresh sweet and sour cherry varieties in MY 2025/26 was 631,000 metric tons. Globally, this represents about 13.6% of total cherry output. Of this volume, about 2,000 metric tons came from non-commercial production, meaning cherries grown by farms or hobby growers primarily for home or on-farm consumption rather than commercial scale. The total cherries produced were harvested from 74,000 hectares.
- Production (MY 2024/25): 684,200 metric tons
- Year-over-change: -8%
- 10-year production stats (MY 2016-2025):
- Average production: 381,894 metric tons
- Compound average growth: 18%
4. United States
The United States accounts for an important 8.7% of the world’s cherry production in MY 2025/26, totaling 401,302 metric tons.
- Production (MY 2024/25): 425,080 metric tons
- Year-over-year change: -6%
- 10-Year production stats (MY 2016-2025):
- Average production: 407,271 metric tons
- Compound average growth: -1%
5. Russia
Cherry production in Russia of 318,800 metric tons for MY 2025/26 corresponds to about 6.9% of worldwide production. Because geographic conditions such as climate and topography heavily influence agricultural production, USDA categorizes each nation into 14 regions to study their region-wise contributions. Region-wise, Russia accounted for a 32.43% share of cherries produced by the ‘12 former Soviet Union countries’ region (excluding Baltic countries).
- Production (MY 2024/25): 318,800 metric tons
- Year-over-year change: 0%
- 10-Year production stats (MY 2016-2025):
- Average production: 301,210 metric tons
- Compound average growth: 2%
6. Uzbekistan
Uzbekistan’s fresh cherry harvest of 303,400 metric tons in MY 2025/26 is another major contributor to the former Soviet Union region's cherry output, accounting for 30.87% of the region. The nation’s global output share closely rivals Russia's, at 6.5%.
- Production (MY 2024/25): 303,400 metric tons
- Year-over-year change: 0%
- 10-Year production stats (MY 2016-2025):
- Average production: 258,120 metric tons
- Compound average growth: 6%
7. Turkey
In MY 2025/26, Turkey's cherry output was calculated at 288,800 metric tons. According to the USDA, it accounts for 6.2% of worldwide production.
- Production (MY 2024/25): 933,200 metric tons
- Year-over-year change: -69%
- 10-Year production stats (MY 2016-2025):
- Average production: 806,468 metric tons
- Compound average growth: -10%
8. Iran
With a 5.8% share of the world’s cherry output, Iran also leads global cherry production. In MY 2025/25, by generating a total output of 270,000 metric tons, Iran claimed a 19.73% share of the total cherry produced in the Middle East region.
- Production (MY 2024/25): 270,000 metric tons
- Year-over-year change: 0%
- 10-Year production stats (MY 2016-2025):
- Average production: 253,181 metric tons
- Compound average growth: 0.98%
9. Ukraine
According to USDA records for the 2025/26 marketing year, Ukraine’s registered cherry output of 226,900 metric tons adds 4.9% to global cherry production. It is the third major former Soviet Union-12 nation that contributed significantly to regional production, at 23.08%.
- Production (MY 2024/25): 226,900 metric tons
- Year-over-year change: 0%
- 10-Year production stats (MY 2016-2025):
- Average production: 240,380 metric tons
- Compound average growth: 0.32%
10. Serbia
In MY 2025/26, Serbia produced 156,400 metric tons of cherries, making up 3.4% of the world’s production.
- Production (MY 2024/25): 156,400 metric tons
- Year-over-year change: 0%
- 10-Year production stats (MY 2016-2025):
- Average production: 151,010 metric tons
- Compound average growth: 3%